|
|
||||
Keywords
Text entity, Vocabulary, Graph, Data structure, Dependency, Independency, Graph drawing, Curricular, Metrics, Documentation, Progression, Consistency, Uniformity, Proportionality, Intraorthogonality, Interorthogonality, Software, Statistical, Inclusion
Table of Contents
Structured Text Entities
The Graph Associated to The Entities
Associated Metrics
Software for Evaluating Structured Entities
Conclusions
References
Abstract
In the educational process, the disciplines D1, D2,...,Dn have a succession which is generated by the content and the final objective – the student formation. In this work, the disciplines are presented as structured text entities. The graph associated to the disciplines is established. A method for dependencies evaluation is proposed. The testing is done with 9 sets of representative input data.
Structured Text Entities
Text entities are used for storing and organizing texts representing very diversified information. The naming of entity indicates the generality of the concept, as the text represents information, which is able to be structured according to the origin and the scope which is associated to this.
The following base concepts regarding text entities are defined:
· the alphabet A is a finite multitude formed of N symbols:a1, a2, … , aN;
· the separator is a symbol which does not belong to the alphabet A, having the role of delimitating two words that form a words sequence;
· the word is a succession formed out of symbols which follow one another. A word cj is characterized by its length, lg(cj) expressed as a number of characters that participate to the formation of word;
· the vocabulary VA is a multitude of different words. The length of the vocabulary VA, noted as Lgv(VA) indicates the number of words which participate to the formation of the vocabulary;
· the text vocabulary is constructed of a multitude of different words which appear in the text. The text vocabulary, VT, is included in the vocabulary VA. Sometimes, VT is identical with VA;
· the frequency of apparition for the word cj, noted as fj shows the number of apparitions for the word cj in the text T. The frequency of apparition for the symbol ai in the text T shows the number of apparitions for this symbol and it is noted as gj;
· the sub-vocabulary is a part of the vocabulary constructed in such way that the intersection of any sub-vocabulary pair leads to void multitude of elements. Sub-vocabularies are disjoints multitudes of elements;
· the text T is a succession of words from vocabulary VA separated by special symbols which are called separators. The text length Lgt(T) states the number of words which form the text. The text length Lgts(T) states the number of symbols which goes into the formation of the text T.
The entities which are based on texts are actually constructions formed out of word sequences characterized by the positions of words within the text, by the grouping of words for the purpose of defining a context, by the making of a correspondence between the words and the elements, actions and real world elements, with qualitative attributes that groups concrete aspects from the reality in homogenous collectivities taking in consideration predefined criterion.
In [IVAN05], there are presented elements which must taken in consideration for constructing a text entity:
· clear delimitation of the tackled field;
· the defining of key words for the field; for a text entity developed in a field, there must be identified those words that describe it in the most synthetic way;
· the usage of the vocabulary in which the key words vocabulary is also included;
· the knowledge of the concepts, techniques, methods, methodologies, technologies which are specific for the field;
· documentation regarding the detail elements and those connected to other fields of activity;
· following the rules of the syntax for each language;
· following the rules regarding text entities structure, gradual tackle of the problem, usage of standard formats for representation of text typed information.
Some representative examples of text entities are: scientific, literal, cultural words, web pages which are found on the Internet, the source code of the software products, dictionaries, phone books and any other grouping entity that exists as a text or is able to be structured as a text.
A particular case of text entity is represented by the list of disciplines within the learning system. A discipline is a text entity, formed out of a multitude of concepts that belong to it along with the definitions, demonstrations and corresponding examples.
Each text entity ET is formed out of NT components noted as SET1, SET2, … SETNT and each component has its own vocabulary, which represents a sub-vocabulary for the parent entity. The text entities structures are established based on the relations between entities, relations that are formed taking into consideration the connections between the component vocabularies, meaning the entities sub-vocabularies. In this way, for describing the entities structures and also the connections which are formed between these ones, it is necessary to analyze the base level, of words and words vocabulary.
Considering the vocabularies V1, V2, … VNV,
with
![]()
![]() and
and
![]() , it results that between the announced
vocabularies a independency relation is established, meaning that the concepts
have nothing in common. The graphic for this type of relation is presented in figure
1.
, it results that between the announced
vocabularies a independency relation is established, meaning that the concepts
have nothing in common. The graphic for this type of relation is presented in figure
1.
Fig. 1. Independency relation between vocabularies
Linear dependency relations between vocabularies, as opposed to independency relations presented previously, indicate the presence of some connections between vocabularies. These connections are condensed in two categories:
-
full dependency, when the vocabularies
are fully included one in the other:
![]() , case in which the concepts contained in the vocabularies
with lower index are assumed and further extended in vocabularies with higher index.
Such type of relation between vocabularies is presented in figure 2;
, case in which the concepts contained in the vocabularies
with lower index are assumed and further extended in vocabularies with higher index.
Such type of relation between vocabularies is presented in figure 2;

Fig. 2. Full dependency relation between vocabularies
-
partial dependency which forms when
the vocabularies are not totally included one in the other, but some concepts that
are assumed exist so that
![]() ,
,
![]() ,
,
![]() ,
,
![]() and
and
![]() . The partial dependency
relation between vocabularies is presented in figure 3.
. The partial dependency
relation between vocabularies is presented in figure 3.

Fig. 3. Partial dependency relation between vocabularies
Other types of relations form by combining the already defined ones,
so that in figure 4, a vocabulary which holds in its composition two independent
vocabularies is presented. It is the case in which
![]() and
and
![]() and
and
![]() . The graphic representation is presented
in figure 4.
. The graphic representation is presented
in figure 4.
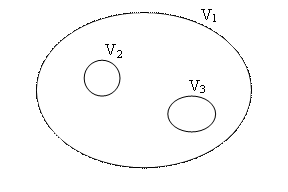
Fig. 4. Combination of dependency and independency relations between vocabularies
When between two partial dependent vocabularies, the connection section
between them is fully dependent of other two vocabularies which are partially dependent
between themselves,
![]() ,
,
![]()
![]() ,
,![]() ,
,![]() and the resulted structure is
graphically displayed in figure 5.
and the resulted structure is
graphically displayed in figure 5.
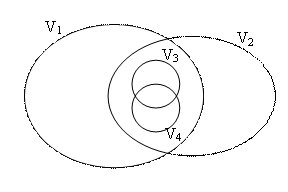
Fig. 5.Combination of partial and full dependency between entities which are partial dependent and have another partial dependent relation between entities in the connection section
For a practical implementation of the presented concepts, three text entities are considered: the first one represented by the current work and the two others extracted from the bibliography included in it, [IANA06] and [IVAN05]. The graphical display of the structure that forms is presented in figure 6.
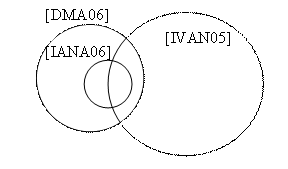
Fig. 6. Structure showing the relations between the current work and two works papers included in its bibliography
According to the structure, the current work [DMA06], completely includes the work [IANA06], meaning that it assumes all the concepts which are further tackled and extended, but it also includes a part of the work [IVAN05], part that is also divided in two categories:
- the first category is the one included in the current work, and which also exists in both [IANA06] and [IVAN05];
- the second category is the one included in the current work [DMA06] just from [IVAN05], without being presented the concepts in[IANA06].
The Graph Associated to The Entities
A dependency graph is a graph whose nodes are represented by different types of entities among which there are distinguished some dependency relation by using arcs. The precedence is a dependency which is transposed to the time line. Thus, some operations which take place have precedence while the concepts within a learning domain depend one on another in such way so that they must be preceded in the approach.
The graph node represents the text entity, or a component of it having the corresponding vocabulary. The precedence is established either by using directional arcs, when the resulted graph is directional or by using simple arcs with priority decreasing from left to right and from up to down when the graph is not directional.
For the structures presented in chapter 1, the dependency graphs associated are presented:
- for the structure presented in figure 1, the associated graph is the one from the figure 7;

Fig. 7. Graph associated to the structure presented in figure 1
- for the structure that has the diagram in figure 2, the graph from the figure 8 results;

Fig. 8. Graph associated to the structure presented in figure 2
- in figure 9, it is presented the graph associated to the structure presented in figure 3;

Fig. 9. Graph associated to the structure presented in figure 3
- the graph for the structure in figure 4 is the one drawn in figure 10. V1 is dependent both on V2 and V3, which means that in V1 all the concepts from V2 and V3 are assumed and extended;

Fig. 10. Graph associated to the structure presented in figure 4
- the dependency graphs for the structure in figure 5, with the elimination of the intersections between arcs, and without the elimination of these are presented in figure 11 and 12 respectively. V3 and V4 are partially dependent and they represent the base for entities V1 and V2 being completely included in their common section.


- for the structure presented in figure 6, the constructed dependency graph is the one presented in figure 13..

Fig. 13. Graph associated to the structure presented in figure 6
The dependency graph is the same with the one in figure 8, this fact showing that even if the dependency is represented, the quantity of elements in connection does not have a specific meaning within the drawing.
Associated Metrics
In [IVAN05] a metric is defined as being a mathematical model with the following form:
![]()
where:
- y is a model which depends on the values x1, x2, … , xnft for the factors Ft1, Ft2, … , Ftnft;
- xi is the numerical value for the influential factor Fti;
- Fti represents the influential factor I from the multitude of factors that determine the variable which shows the result y.
Through the mathematical model, the quantification of the characteristics for the analyzed entity is obtained.
The work [BOJIO04] mentions that the metrics have the following functions:
· measuring – values for the elements from the text entity structure are distinguished;
· comparing – the resemblances and differences between two or many analyzed entities for classification or hierarchically categorizing are pointed out;
· analysis – has the role of distinguishing the quality characteristics of the analyzed entities;
· synthesis – consists in extraction of what is essential for an analyzed text entity collectively;
· estimation – future evolutions of the behaviour for the analyzed text entity are established;
· verification – implies the validation of mathematical models associated to the metrics.
For measuring purposes, quality characteristics for text entities are taken from [IANA06] and presented:
Documentation is a very important quality characteristic. A text entity is defined by using an expert vocabulary VT. to justify the documentation, the following must be taken into consideration so that:
· the bibliography’s article titles must have as a base a vocabulary VB included in vocabulary VT;
· the article words written by the entity authors must form a vocabulary VA included in the vocabulary VT.
The quality of progression refers to the gradual nature of the approach. The concepts are treated from closer to closer so that:
· primary concepts that are clarified by examples are considered;
· based on primary concepts, new concepts are defined, some of them being derived from others;
· the connections between concepts are assured by formulas, examples and diagrams;
· the synthesis and analysis determine the particularization and aggregation of all the presented elements;
· the particularization is obtained from a definition of concepts to another.
The consistency implies the existence of some definitions, relations and presentations so that a logical succession is possible to be obtained. The particularization level grows with the growing text.
The uniformity consists in the usage with the same intensity of the bibliographic sources in the development of the concepts as well.
If a text entity ET aims to tackle a specific field as a synthesis, this implies that a bibliography formed out of titles G1,G2, ..., GH, where h represents the length of the bibliography expressed as a number of used works, exists.
The uniformity means that the references of the works are done in equal measure for each of them. The analysis of this quality characteristic implies the parsing of ET entity for frequencies fi computing for which the work Gih from the bibliography is referenced, i =1,2...
For the quality analysis of the entities, the following must be obtained:
· the length of the entities ET in total number of words;
· the length of the entity ET in total number of essential words, which is obtained by eliminating the connection words and the words which are not modified regardless the context;
· the length of the entity vocabulary as a number of maximum orthogonal words, by regrouping the results obtained by deriving a root word;
· the frequencies for the essential words which form a vocabulary;
· the frequencies fi for the totals Gi references, with i =1,2...,h;
· the indicators used in determining the quality of the references, such as:
o the quantity of bibliography titles, introduced without being quoted, Ipn, that it is calculated using the relation:

where

o the quantity of the quoted titles, Ipc, being calculated using the relation:
Ipc = 1- Ipn
o the quantity of excessively quoted titles, Ipex, calculated with the relation:

where

o
the list of excessively quoted titles, Gj1
Gj2 ... Gjx for which
![]() ;
;
o the list of unquoted titles, Gj1 Gj2 ... Gjr for which fjs = 0, js = {j1, j2, ... jr}.
Proportionality is a very important characteristic by the sense and especially the effects which are determined during each entity reference process.
As well as all the reality is formed out of objects, processes, phenomena, beings characterized by structures formed out of components which interact, the text entities, as a reflection of the reality, even if they are artificially constructions, also consist of interacting components.
Proportionality is represented through the attention for the real world analysis. To a complex subsystem, a subtext with a bigger length than the length of a simple subsystem must correspond. Proportionality is represented by the relation within the text entity, itself.
Intraorthogonality is the quality characteristic that marks the differences among some text entity components.
The ET text entity having the tree structure from figure 14 is considered.
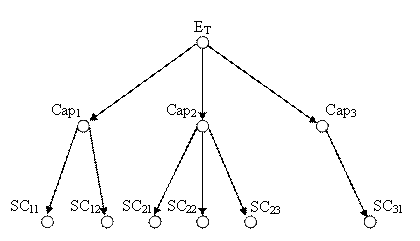
Fig. 14. Tree structure corresponding to a text entity
The subtexts SCij are orthogonal between themselves if
and only if H(SCij;SCkl) ->1,
![]()
Intraorthogonality reveals how different the parts that form a text entity are.
In case in which some concepts are treated again, the intraorthogonality declines.
When at each subchapter level the concepts and concepts connections graph are planned, the result consists in sub-graphs with nodes arranged on levels.
The nodes are connected only with simple arcs that connect nodes from adjacent levels, as showed in figure 15.
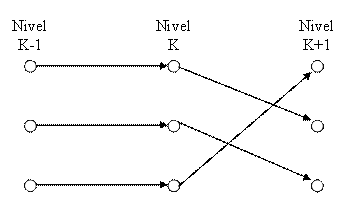
Fig. 15. Graph structure with arcs connecting adjacent nodes
Interorthogonality refers to the entities differences and reveals the measure in which they differ as presentation form or content.
Considering two text entities, they tend to be orthogonal, as they do not treat similar concepts.
For example, the works elaborated in a specific field, are orthogonal if their texts have in common only the words that are characteristic for the field with the other words being very different as apparition frequency and position [IVAN05].
Software for Evaluating Structured Entities
With the purpose of dependency graphs elaboration and analysis performing based on showed structures for obtaining the desired different forms of output data, SESE application is developed – Software for Evaluating Structured Entities. The behavior of the application in different contexts is analyzed within this chapter. The product development is done in .NET platform, by using the C# language, according to the diagram presented in figure 16.
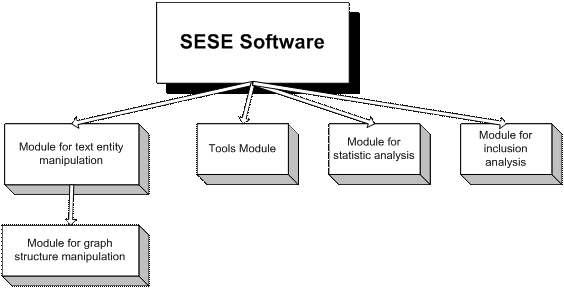
Fig. 16. Software structure
The module for graph structure manipulation contains the graph structure definition that represents the most important part of the whole application..
The module for text entity manipulation refers to the structure which is defined within the module according to the concepts presented in chapter 1.
The tools module is composed of different objects used within the application for many types of operations such as: windows and XML files manipulation.
The statistical analysis module elaborates the dependency graph for some entities based on statistic indicators.
The module for inclusion analysis contains functions and algorithms for dependency analysis among the entities based on their vocabularies.
For statistical analysis module testing, the sets containing input data are shaped by collecting options tables from the terminal year students, in which they state the disciplines order that they consider as optimal for all concepts within the disciplines understanding. The results generated by the application with 9 representative input sets of date are presented:
- the set 1 with input data is presented in table 1:
Table no. 1. The set 1 with input data
|
Discipline Name |
S1 |
S2 |
S3 |
S4 |
|
Alg – Algebra |
Alg |
Ec |
Stat |
Stat |
|
Ec – Economics |
Ec |
Alg |
Alg |
Ec |
|
Stat – Statistics |
Stat |
Stat |
Ec |
Alg |
|
Micro – Micro-economics |
Micro |
Micro |
Micro |
Micro |
|
Macro – Macro-economics |
Macro |
Macro |
Macro |
Macro |
The dependency graph for the disciplines presented in table 1 is the one in figure 17. which shows three independent disciplines and another discipline, Micro-Economics, which is dependent of all three, and also Macro-economics which is dependent of Micro-economics.
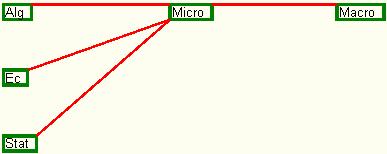
Fig. 17. The dependency graph for set 1 of input data
- the set 2 with input data, which is presented in table number 2, has as result, as figure 18 shows, a graph in shape of a triangle, in which OOP and Networks are independent between each other, but both dependent on PE, and PM dependent both on OOP and on Networks..
Table no. 2. The set 2 with input data
|
Discipline Name |
S1 |
S2 |
|
PE – Programming Engineering |
PE |
PE |
|
OOP – Object Oriented Programming |
OOP |
NET |
|
Net - Networks |
Net |
OOP |
|
PM – Project Management |
PM |
PM |
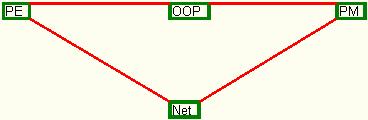
Fig. 18. The dependency graph for set 2 of input data
- the set 3 of input data according to table number 3, leads after applying the algorithm to the graph presented in figure 19.
Table no. 3. The set 3 with input data
|
Discipline Name |
S1 |
S2 |
S3 |
S4 |
|
OS – Operating Systems |
OS |
OS |
OS |
OS |
|
BTI - Business Technologies on Internet |
BTI |
MM |
DBMS |
DBMS |
|
MM – Multimedia |
MM |
BTI |
BTI |
MM |
|
DBMS – Database Management Systems |
DBMS |
DBMS |
MM |
BTI |
|
PM – Project Management |
PM |
PM |
PM |
PM |
|
SDU – Software Development and Usage |
SDU |
APL |
SDU |
APL |
|
APL – Advanced Programming Languages |
APL |
SDU |
APL |
SDU |
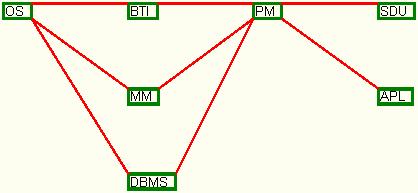
Fig. 19. The dependency graph for set 3 of input data
Figure 19 presents a combination of precedent cases, in which dependencies as well as independencies are presented together.
- the set 4 of input data is represented by the table number 4:
Table no. 4. The set 4 with input data
|
Discipline Name |
S1 |
S2 |
S3 |
S4 |
|
DS – Data Structures |
DS |
PE |
PA |
PA |
|
PE – Programming Engineering |
PE |
DS |
DS |
PE |
|
PA - Programming Algorithms |
PA |
PA |
PE |
DS |
|
DBMS – Database Management Systems |
DBMS |
DBMS |
DBMS |
DBMS |
|
OS – Operating Systems |
OS |
CS |
OS |
CS |
|
CS – Computing Systems |
CS |
OS |
CS |
OS |
|
PM – Project Management |
PM |
PM |
PM |
PM |
The resulted graph for data in table number 4 is drawn in figure 20, which is also a combination of the precedent test cases.
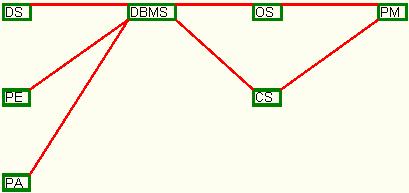
Fig. 20. The dependency graph for set 4 of input data
- the set 5 of input data consists of data from the table number 5. According to it, all the students have chosen the disciplines in the same order, which means that they are dependent between each other based on the order in which they were chosen. The resulted graph is the one from figure 21.
Table no. 5. The set 5 with input data
|
Discipline Name |
S1 |
S2 |
S3 |
|
DS – Data Structures |
DS |
DS |
DS |
|
PE – Programming Engineering |
PE |
PE |
PE |
|
PA - Programming Algorithms |
PA |
PA |
PA |
|
DBMS – Database Management Systems |
DBMS |
DBMS |
DBMS |
|
OS – Operating Systems |
OS |
OS |
OS |
|
CS – Computing Systems |
CS |
CS |
CS |
|
PM – Project Management |
PM |
PM |
PM |
|
SDU – Software Development and Usage |
SDU |
SDU |
SDU |
![]()
Fig. 21. The dependency graph for set 5 of input data
The resulted graph is a linearly structured one, in which every node has a connection with a single node which also comes-next-after.
For testing the inclusion analysis module, instead of establishing the dependencies based on the statistic calculation, the connections between entities sub-vocabularies are considered. Thus, for the entity noted as ET that has the components SET1, SET2,…, SETNT, between them, relations like the ones seen in chapter 2 are established, these being essential for text entities structure creation. The application with various sets of input data returns the following results:
- the set 6 of input data refers to words dictionaries analysis and it is represented in table number 6 containing the definitions for words football, game, activity and multitude.
Table no. 6. The set 6 with input data
|
Word |
Definition |
|
Football |
Game between 2 teams with 11 persons |
|
Game |
Fun activity for humans beings |
|
Activity |
Multitude of actions to reach a purpose |
|
Multitude |
Resulted from unification |
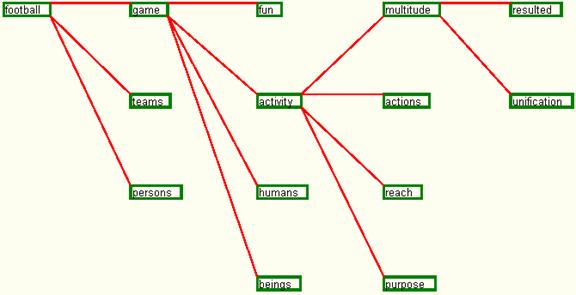
Fig. 22. The dependency graph for set 6 of input data
After selecting the graph drawing option for the word football, the application returns the representation from figure 22 which shows all the necessary words for the understanding of word football, along with the connections between them.
After removing the intermediary words, the graph modifies, so that it contains just the root and the leaves of the tree represented in figure 22. The structure so modified is represented in figure 23 and it actually shows the necessary concepts to understand the word, without including the other words which have only been necessary to reach this level.
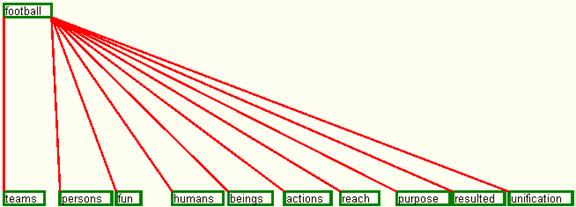
Fig. 23. The dependency graph for set 1 of input data without intermediary nodes
- the set 7 of input data is represented by the activity fields like the ones seen in table number 7, that have associated specific concepts, instead of definitions according to a dictionary of words as previously.
Table no. 7. The set 7 with input data
|
Terms |
Associations |
|
Computer-Operations |
Computer, Display, Keyboard, Windows |
|
Programming |
Computer-Operations, Algorithms |
|
Project-Management |
Programming, OOP |
The resulted dependency graph for the Project-Management activity is described in figure 24.
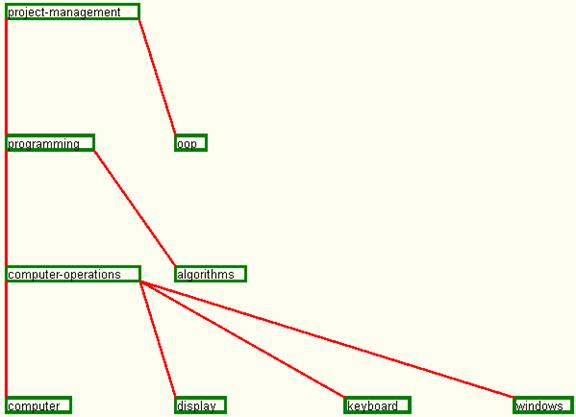
Fig. 24. The dependency graph for set 7 of input data
Thus, all the activities and corresponding concepts are structured as a graph, in which the arcs between nodes show the dependencies. After removing the intermediary nodes, the resulted graph presented in figure 25 shows in a more simple form all the concepts which are necessary for the Project-Management activity.
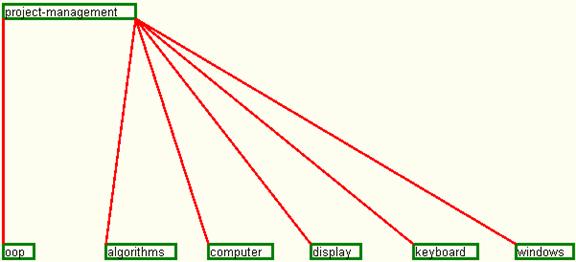
Fig. 25. The dependency graph without intermediary nodes for the project-management activity according to set 7 of input data
- the set 8 of input data represents a grade one error from a dictionary of words. Thus, considering the definition from table number 8, the resulted graph is the one drawn in figure 27.
Table no. 8. The set 8 with input data
|
Word |
Definition |
|
Flower |
Plant with shape as a flower |
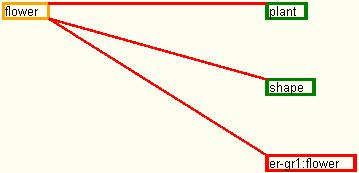
Fig. 27. The dependency graph for set 8 of input data
The grade one error is stated when a recurrence within the definition occurs. In this way, the concept of flower is not fully understood because of the use of the same concept within the same definition.
- the set 9 of input data presents a grade two error for a dictionary of words. Two definitions for concepts of flower and plant are presented in table number 9.
Table no. 9. The set 9 with input data
|
Word |
Definition |
|
Flower |
Nature plant |
|
Plant |
Flower that grows from soil |
The resulted dependency graph is the one drawn in figure 28.
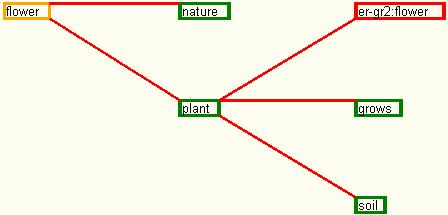
Fig. 28. The dependency graph for set 9 of input data
Thus, for understanding the concept of flower, the word plant used within the definition presents its own definition, which contains the initial word flower. In this way, the dictionary contains an error, being qualified as grade two error because of the level at which the recurrence occurs.
Conclusions
The fields in which the interdependencies between different types of entities are able to be shaped and structured based on dependency graph are countless. The purpose of developing a software product to generate these types of graphs is to go deeply into the process of obtaining quality structures for precedence analysis of different types of entities.
The graph is a very malleable structure with possibilities to reach, especially by using recursive mechanisms, levels of advanced complexity. This structure, applied to text entity, offers the possibility of processing analysis or other operations on texts by using the computer. Text entity also offers a very big coverage. In this way, the linking of the two concepts leads to notable results.
References